Overview
The global Fisheries and Aquaculture Market was valued
at USD 320.0 billion in 2025 and is projected to reach USD 496.4 billion by
2034, growing at a CAGR of 5.0% during the forecast period (2026–2034). The
market growth is driven by rising seafood consumption, increasing aquaculture
production, growing demand for protein-rich food, expansion of seafood trade
and cold-chain infrastructure. The market is shifting from volume-led wild
catch and low-input small-scale farming toward managed, data-driven and
traceable production. Government initiatives such as the WTO Agreement on
Fisheries Subsidies, which entered into force on 15 September 2025 and
prohibits subsidies linked to illegal fishing and overfished stocks, India's
Pradhan Mantri Matsya Sampada Yojana (PMMSY), which helped lift India's fish
production to 197.75 lakh tonnes in 2024-25, and the United States Executive
Order 14276 of April 2025 on seafood competitiveness are shaping investment,
trade and regulation across the industry. By region, Asia-Pacific held the
largest share of the market in 2025, accounting for 64% of global value,
supported by large farming bases in China, India, Indonesia, Vietnam and
Bangladesh. Latin America is expected to be the fastest-growing region during
the forecast period, driven by Ecuador's shrimp expansion, Chile's salmon
sector and Brazil's tilapia farming.
Market Size & Share
| Study Period |
2021-2034 |
| Market Size in 2025 |
USD 320.0 Billion |
| Market Size in 2026 |
USD 336.0 Billion |
| Market Size by 2034 |
USD 496.4 Billion |
| Unit Value |
USD Billion |
| Largest Region |
5.0% (2026-2034) |
| Projected CAGR |
Asia-Pacific |
| Fastest-Growing Region |
Latin America |
| Fastest-Growing Species Group |
Crustaceans |
Market Dynamics
KEY MARKET TREND
Digital Monitoring, AI-Based Feeding and Land-Based and Offshore
Farming Systems Emerging as a Transformational Trend
- Farms
are moving from manual observation to underwater cameras, oxygen and
water-quality sensors, biomass monitoring and AI-based feeding, which help
improve feed conversion, fish health and survival rates.
- Technology
suppliers are widening their portfolios across sea-based infrastructure,
land-based recirculating systems and farm software, as producers look for ways
to reduce disease, lice and site-permit pressure.
- Adoption
started in salmon and is spreading to shrimp, trout and tilapia farms, with
certification schemes such as ASC and BAP pushing producers toward better data,
traceability and environmental reporting.
- Ambienta,
a European sustainability-focused asset manager, announced on 1 October 2026
that it had acquired four aquaculture technology companies to build a Nordic
platform covering underwater lighting, oxygenation, environmental monitoring,
mechanical delousing, digital feeding, UV-C treatment, biomass monitoring and
sludge treatment.
KEY MARKET DRIVER
Rising Global Seafood Demand and Aquaculture's Growing Share of Food
Supply is the Key Driver
- Aquatic
animal foods supply at least one-fifth of the animal protein intake of 3.1
billion people, and about 89% of aquatic animal production goes to human
consumption, which keeps demand steady and widespread.
- Wild
capture has stayed in a narrow 86–94 million tonne range since the late 1980s,
so almost all additional supply must come from farming, which pushes investment
into hatcheries, feed, equipment and processing.
- Trade
in aquatic animal products reached a record USD 184 billion, and more than
one-third of production is traded across borders, supporting exporters of
salmon, shrimp, tuna and tilapia.
- FAO's
State of World Fisheries and Aquaculture 2026 reports 235 million tonnes of
production in 2024, with aquaculture of aquatic animals at 103 million tonnes
valued at USD 371 billion at farm gate, and projects aquaculture to reach 119
million tonnes by 2034.
KEY MARKET OPPORTUNITY
Expansion of Offshore Farming, Alternative Feed Ingredients and
Cold-Chain Infrastructure Creating New Revenue Streams
- Offshore
and open-water farming allows producers to use new sites away from crowded
coastal waters, creating demand for stronger pens, moorings, feeding systems
and monitoring tools.
- Fishmeal
and fish oil supply has stayed near 5 million and 1 million tonnes a year since
the mid-2000s while aquaculture takes over 90% of fishmeal, opening room for
algae, insect, single-cell and by-product ingredients.
- Africa,
South Asia and Latin America still have gaps in cold storage, hatcheries and
processing, which creates opportunities for equipment suppliers, feed makers
and integrated seafood companies.
- Ocean
Era and GulfStream Aquaculture received the final permit in July 2026 for the
Velella Epsilon demonstration, which will raise a batch of red drum in a net
pen more than 40 miles off Sarasota, Florida, after an eight-year permitting
process involving nine federal and state laws and 12 agencies.
Fisheries and Aquaculture Market Size, 2025-2034 (USD Billion)
Segmentation Analysis
Analysis by Species Group
Finfish held the largest market share in 2025 because
carp, tilapia, catfish, salmon, trout and tuna make up the bulk of both farmed
and wild output. Freshwater finfish farming is the backbone of food supply in
China, India, Bangladesh and Indonesia, while salmon and trout generate high
value in Norway, Chile and Canada. FAO data show that inland aquaculture alone
produced 64.3 million tonnes in 2024, mostly finfish. Steady household demand
and wide availability of affordable species keep finfish well ahead of other
groups.
Crustaceans are projected to grow at the fastest CAGR
during the forecast period, driven by strong shrimp demand and rising farm
productivity in Ecuador, India, Vietnam and Indonesia. Ecuador's farmed shrimp
exports reached USD 7.47 billion in 2025, up 23.2% from 2024, according to the
country's National Aquaculture Chamber. Better genetics, hatchery quality and
disease control are helping farms raise output, while growing processing
capacity supports higher-value peeled and cooked products.
Species Group categories include
- Finfish
(Dominating Segment)
- Crustaceans
(Highest CAGR Segment)
- Molluscs
- Aquatic
Plants & Seaweed
- Others
Analysis by Production System
Pond culture held the largest market share in 2025
because inland aquaculture accounts for 62.6% of world aquaculture output of
aquatic animals, and ponds are the main inland system in Asia. Low capital
cost, use of local feed and simple management make ponds suitable for millions
of small farmers. India's average aquaculture productivity rose to about 4.7
tonnes per hectare by early 2025 under PMMSY, showing how better pond
management lifts output. Government support for pond renovation, seed supply and
training continues across Asia and Africa.
Recirculating Aquaculture Systems (RAS) are projected to
grow at the fastest CAGR during the forecast period, driven by the need to farm
closer to markets, save water and reduce disease and lice risks in sea pens.
Equipment suppliers report strong demand for land-based post-smolt and grow-out
systems, and AKVA group's revenue rose to NOK 4.4 billion in 2025. Better
energy efficiency, automation and biological monitoring are making RAS more
practical for salmon, trout, shrimp and high-value marine species.
Production System categories include
- Pond
Culture (Dominating Segment)
- Recirculating
Aquaculture Systems (Highest CAGR Segment)
- Net
Pen Culture
- Marine
Capture Fisheries
- Inland
Capture Fisheries
- Others
Analysis by Product Form
Chilled seafood held the largest market share in 2025
because most fish is sold close to where it is produced, especially in Asia and
Africa, where live, fresh and chilled products are preferred in wet markets and
retail. In Europe and North America, chilled salmon, trout and whitefish
fillets move quickly through air and road freight. Short supply chains,
consumer preference for freshness and the large volume of domestic trade in
producing countries keep this form in the lead.
Processed seafood is projected to grow at the fastest
CAGR during the forecast period, supported by demand for ready-to-cook,
ready-to-eat and portion-ready products. India approved Rs 2,797 crore under
PMMSY and the Fisheries and Aquaculture Infrastructure Development Fund up to
April 2026 for cold chain and marketing infrastructure. Ecuador is also
building processing capacity to move from whole shrimp to higher-value
products, which improves margins for producers.
Product Form categories include
- Chilled
(Dominating Segment)
- Processed
(Highest CAGR Segment)
- Frozen
Analysis by End Use
Human consumption held the largest market share in 2025
because about 89% of aquatic animal production goes directly to food, according
to FAO. Aquatic foods provide at least one-fifth of animal protein for 3.1
billion people, and per-person seafood use is rising in Asia, Africa and the
Middle East. Retail, restaurants and food processors all buy large volumes of
fish and shellfish. Trade in aquatic animal products reached USD 184 billion,
showing the depth of food demand worldwide.
Marine ingredients are projected to grow at the fastest
CAGR during the forecast period, because FAO expects aquaculture to rise from
103 million tonnes in 2024 to 119 million tonnes by 2034 and fed species need
more feed. Since fishmeal and fish oil supply is flat, companies are investing
in new ingredients and circular raw materials. BioMar's purchase of a feed
research station in 2025 and GC Rieber's acquisition of Biomega in January 2026
reflect this focus.
End Use categories include
- Human
Consumption (Dominating Segment)
- Marine
Ingredients (Highest CAGR Segment)
- Pharmaceuticals
- Industrial
By Region
Fisheries and Aquaculture Market Share 2025, (CAGR)
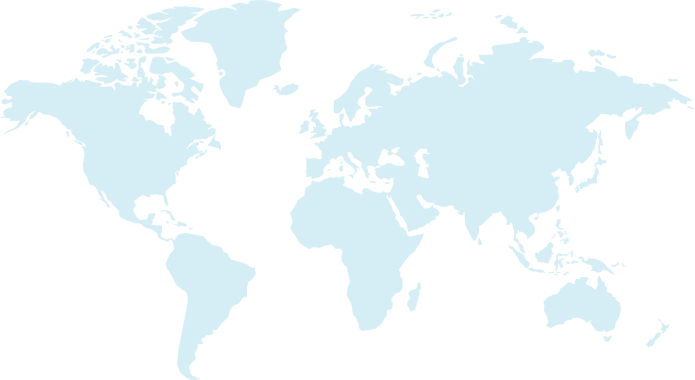
Asia-Pacific held the largest market share in 2025, accounting for
64% of global market share. FAO data show that China, Indonesia, India, Viet
Nam and Bangladesh together account for 82% of farmed aquatic animal
production. China represents the largest country market in the region,
supported by large-scale aquaculture, seafood processing and aquafeed
production. India is the fastest-growing country market, with fish output
rising to 197.75 lakh tonnes in 2024-25 under PMMSY, while the country became
the world's second-largest producer of aquatic animals in 2024. South Korea and
Japan maintain strong positions in tuna, seaweed, aquaculture, seafood
processing and exports. The Rest of Asia-Pacific, including major producers
such as Indonesia, Viet Nam and Bangladesh, adds substantial demand through
expanding aquaculture and fisheries activities. Governments across the region
support the market through pond and cage development, cold-chain funding,
hatchery programs and disease-control rules, while WTO subsidy rules apply to
fishing support. Technology adoption is rising through aerators, sensors and
recirculating systems. The competitive landscape includes large Chinese feed
and farming groups, Thai integrated producers, Japanese fishing and processing
companies and many small farmers.
Latin America is projected to grow at the fastest CAGR during the
forecast period, led by Chile, Brazil and other major aquaculture markets.
Chile is the largest country market in the region, supported by its large
salmon and trout sector, while Brazil is expanding through tilapia farming and
seafood production. Ecuador remains a major shrimp producer, with farmed shrimp
exports reaching USD 7.47 billion in 2025, up 23.2%. The Rest of Latin America
also contributes through expanding shrimp, fish farming and seafood-processing
activities. Governments support growth through export promotion and sanitary
controls, and Ecuador introduced a mandatory qualification for sodium
metabisulfite users from 1 January 2026. Producers are adopting better
genetics, automated feeders and processing plants to move into higher-value
products. The competitive landscape combines local shrimp exporters with global
salmon producers such as Mowi, Cermaq and Cooke, which operate farms in Chile.
Countries and Regions Covered
Asia-Pacific (Dominating Region)
- China
(Largest Country Market)
- India
(Fastest-Growing Country Market)
- South
Korea
- Japan
- Rest
of Asia-Pacific
Latin America (Fastest Growing Region)
- Chile
(Largest Country Market)
- Brazil
- Rest
of Latin America
North America
- United
States (Largest Country Market)
- Canada
- Mexico
Europe
- United
Kingdom
- Italy
- France
- Germany
- Rest
of Europe
Middle East & Africa
- Saudi
Arabia (Fastest-Growing Country Market)
- United
Arab Emirates
- Rest
of Middle East & Africa
Market Share
The
market is fragmented overall, with millions of small fishers and farmers, but
it is consolidating in salmon farming, aquafeed, fishing-and-processing and
farm technology. Leading companies such as Mowi, SalMar, Cermaq, Bakkafrost,
Cooke, Nissui Corporation, Umios Corporation, Thai Union Group, Charoen
Pokphand Foods, BioMar Group, Cargill, Tongwei, Dongwon Industries, Grieg
Seafood and American Seafoods hold strong positions through scale, integrated
supply chains and brand relationships. Key success factors include fish health
and biological performance, feed efficiency, access to licences and sites,
cold-chain reach and certifications. Leading companies are prioritizing farm
automation, disease control, lower-carbon feed, offshore and land-based systems
and value-added products. Partnership and acquisition activity is active, as
seen in Cermaq's purchase of Grieg Seafood's Finnmark and Canadian operations,
AKVA group's 2026 strategic review and Ambienta's 2026 technology platform.
Key Players
- Mowi
ASA (Norway)
- SalMar
ASA (Norway)
- Cermaq
Group AS (Norway)
- Bakkafrost
P/F (Faroe Islands)
- Cooke
Inc. (Canada)
- Nissui
Corporation (Japan)
- Umios
Corporation (Japan)
- Thai
Union Group PCL (Thailand)
- Charoen
Pokphand Foods PCL (Thailand)
- BioMar
Group (Denmark)
- Cargill,
Incorporated – Aqua Nutrition (United States)
- Tongwei
Co., Ltd. (China)
- Dongwon
Industries Co., Ltd. (South Korea)
- Grieg
Seafood ASA (Norway)
- American
Seafoods Group LLC (United States)
Recent Market Developments
- July 2025: Cermaq, owned by
Mitsubishi Corporation, agreed to acquire Grieg Seafood's operations in
Finnmark, British Columbia and Newfoundland for an enterprise value of USD 1.06
billion, and the sale was later completed.
- September 2025: The WTO Agreement
on Fisheries Subsidies entered into force on 15 September 2025 after acceptance
by more than two-thirds of members.
- April 2026: AKVA group, the
Norwegian aquaculture technology supplier, announced a strategic review that
could include a sale, after reporting 2025 revenue of USD 455 million.
- July 2026: SalMar entered an agreement to acquire
approximately 70% of Masoval AS for about USD 352 million. The transaction is
intended to strengthen SalMar's salmon-farming position and support further
sustainable growth in Central Norway.
Frequently Asked Questions
What is the Fisheries and Aquaculture Market?
The Fisheries and Aquaculture Market covers wild fish capture and the farming of fish, crustaceans, molluscs and aquatic plants, along with feed, equipment, processing and related services used to bring seafood to consumers.
What is driving the Fisheries and Aquaculture Market growth?
Growth is driven by rising demand for animal protein, flat wild catch, fast growth of aquaculture, rising seafood trade and investment in farm technology, feed and cold-chain infrastructure.
What is the size of the Fisheries and Aquaculture Market?
The global Fisheries and Aquaculture Market was valued at USD 320.0 billion in 2025 and is projected to reach USD 496.4 billion by 2034, growing at a CAGR of 5.0%.
Which region dominates the Fisheries and Aquaculture Market?
Asia-Pacific dominates the market with a 64% share in 2025, supported by large farming bases in China, India, Indonesia, Vietnam and Bangladesh, while Latin America is the fastest-growing region.
Which species group is growing the fastest in Fisheries and Aquaculture?
Crustaceans are the fastest-growing species group, driven by shrimp demand and expanding production in Ecuador, India, Vietnam and Indonesia.
What are the main end uses of fisheries and aquaculture products?
Major end uses include human consumption, aquafeed and marine ingredients, nutraceuticals and pharmaceuticals, and industrial applications.
Why is the WTO Agreement on Fisheries Subsidies significant for this market?
The agreement entered into force on 15 September 2025 and bans subsidies linked to illegal fishing, overfished stocks and unregulated high-seas fishing, which supports healthier fish stocks and fairer competition.
1
What are Fisheries and Aquaculture?
2
What is the CAGR of the Fisheries and Aquaculture Market?
3
Which species group leads the Fisheries and Aquaculture Market?
4
Which end use dominates the Fisheries and Aquaculture Market?
5
Which production system has the highest market share?

Strong Industry Focus

Extensive Product Offerings

Customer Research Services

Robust Research Methodology

Comprehensive Reports

Latest Technological Developments

Value Chain Analysis

Potential Market Opportunities

Growth Dynamics

Quality Assurance

Post-sales Support

Regular Report Updates