Overview
The global Data Center Infrastructure
Monitoring Market was valued at USD 3.4 billion in 2025 and is projected to
reach USD 12.4 billion by 2034, growing at a CAGR of 15.5% during the forecast
period (2026–2034). The market growth is driven by rising data center
complexity, growing demand for real-time infrastructure visibility, increasing
adoption of cloud and colocation facilities, rising focus on energy efficiency
and operational optimization. The market is shifting from standalone,
facility-level power and temperature monitoring toward converged, AI-enabled
observability platforms that unify electrical, thermal, network, and IT asset
data on a single pane of glass. Rising GPU rack densities associated with AI
workloads, often exceeding 100 kW per rack, are straining traditional
air-cooling monitoring approaches and accelerating the adoption of sensors and
analytics purpose-built for direct-to-chip and immersion liquid cooling.
Government initiatives such as the European Union's Energy Efficiency Directive,
which made mandatory energy-performance disclosure for data centers with an
installed IT power demand of 500 kW or more effective from 1 July 2025 (with
first national reporting deadlines falling in 2026), are directly increasing
demand for continuous, auditable monitoring of PUE, water usage effectiveness,
and renewable-energy utilization. By region, North America held the largest
share of the market in 2025, supported by its dense concentration of hyperscale
and colocation facilities and early adoption of DCIM platforms. Asia-Pacific is
expected to be the fastest-growing region during the forecast period, driven by
rapid data center capacity build-out in China, India, Japan, and Southeast Asia
alongside rising government emphasis on digital infrastructure and energy
efficiency.
Market Size & Share
| Study Period: |
2021-2034 |
| Market Size in 2025: |
USD 3.4 Billion |
| Market Size in 2026: |
USD 3.9 Billion |
| Market Size by 2034: |
USD 12.4 Billion |
| Unit Value: |
USD Billion |
| Projected CAGR: |
15.5% (2026-2034) |
| Largest Region: |
North America |
| Fastest-Growing Region: |
Asia-Pacific |
| Fastest-Growing Monitoring Type: |
Cooling & Environmental Monitoring |
Market Dynamics
KEY MARKET TREND:
AI-Powered Predictive Analytics and
Converged Observability Emerging as a Transformational Trend
- Monitoring vendors are embedding machine-learning
models into existing power, cooling, and network telemetry to move from
threshold-based alerting toward predictive maintenance that flags UPS, battery,
and cooling-unit degradation before failure occurs.
- Platforms are converging previously siloed
monitoring layers, electrical, thermal, network, and physical security, into
unified dashboards so that operations teams can correlate an environmental
anomaly with its downstream IT impact in real time.
- Adoption is being pulled forward by rising GPU
rack densities in AI-focused data centers, which require finer-grained thermal
and power telemetry than legacy air-cooled facilities and are pushing vendors
to extend sensor coverage into liquid-cooling distribution units.
- Sunbird Software released dcTrack 9.3.5, adding
tracking and modeling capability for liquid-cooling infrastructure, reflecting
how established DCIM platforms are extending their asset and monitoring models
to cover direct-to-chip and immersion cooling deployments.
KEY MARKET DRIVER:
Mandatory Energy-Performance Disclosure
and Rising Energy Costs are Key Drivers of Market Growth
- Data center operators face escalating electricity
costs and grid-capacity constraints in major markets, making continuous power and
PUE monitoring essential to identify inefficiencies and control operating
expenses.
- Expansion of hyperscale and edge facilities is
increasing the number of distributed sites that a single operations team must
supervise, driving demand for centralized, remote monitoring platforms rather
than manual, site-by-site checks.
- Growing GPU-driven power density is raising the
operational risk of thermal excursions and unplanned downtime, increasing the
value operators place on real-time environmental and power-chain visibility.
- Under the European Union's Energy Efficiency
Directive, data centers with at least 500 kW of installed IT power have been
required since 1 July 2025 to report annual energy-performance data, including
PUE, water usage, and waste-heat utilization, to a common EU database, directly
mandating the deployment of continuous monitoring infrastructure.
KEY MARKET
OPPORTUNITY:
Expansion of Monitoring-as-a-Service and
Liquid-Cooling Telemetry Creates New Revenue Streams
- Growing preference among small and mid-sized
colocation operators for subscription-based, cloud-delivered monitoring reduces
upfront software and hardware costs and is opening the market to operators that
previously relied on manual facility checks.
- The build-out of AI-optimized data centers with
direct-to-chip and immersion liquid cooling is creating demand for a new
category of coolant-flow, leak-detection, and cooling-distribution-unit sensors
that did not exist in air-cooled facilities.
- Vendors that can package monitoring data into automated
regulatory-compliance reporting, particularly for EU energy-performance
disclosure, stand to capture incremental service revenue beyond core software
licensing.
- FNT Software launched Infrastructure Health and
Monitoring for its FNT Command platform in September 2025, combining documented
infrastructure records with live health data in a single operating interface,
illustrating vendor investment in bundling monitoring with existing
infrastructure-documentation customer bases.

Data Center Infrastructure Monitoring Market Size, 2025-2034 (USD Billion)
Segmentation Analysis
Analysis by
Component
Solutions held the largest market share
in 2025 because monitoring functionality, power meters, environmental sensors,
and the software layer that aggregates and visualizes their data, forms the
core deliverable that operators purchase before layering on services. Bundled
software-and-sensor packages from established power and cooling manufacturers
give operators an integrated starting point for facility-wide visibility,
reinforcing solutions as the primary spending category.
Services are projected to grow at the
fastest CAGR during the forecast period as operators increasingly outsource
installation, calibration, and ongoing monitoring-as-a-service engagements
rather than building in-house expertise, particularly for multi-site colocation
portfolios and organizations navigating new EU energy-disclosure obligations
that require specialized reporting support.
Component categories include
·
Solutions
(Dominating Segment)
·
Services (Highest
CAGR Segment)
Analysis by
Monitoring Type
Power Monitoring held the largest market
share in 2025 because tracking electrical load, UPS status, PDU output, and PUE
remains the foundational use case for infrastructure monitoring and the primary
metric tied to both operating cost and regulatory disclosure requirements.
Power-chain visibility is typically the first monitoring capability deployed in
any facility, giving this category its scale advantage.
Cooling & Environmental Monitoring is
projected to grow at the fastest CAGR during the forecast period, driven by the
shift toward high-density AI racks that require granular temperature, humidity,
and coolant-flow tracking across both air- and liquid-cooled zones. Rising
thermal risk associated with GPU-dense deployments is pushing operators to add
environmental sensor coverage well beyond traditional facility-level readings.
Monitoring Type categories include
·
Power Monitoring
(Dominating Segment)
·
Cooling &
Environmental Monitoring (Highest CAGR Segment)
·
Bandwidth
Monitoring
·
Access Control
Monitoring
·
Capacity
Monitoring
Analysis by
Deployment Mode
On-Premises deployment held the largest
market share in 2025 because hyperscale and large enterprise operators continue
to prefer locally hosted monitoring for latency-sensitive alerting and to meet
data-residency and security requirements tied to critical facility control
systems. Long operating lifecycles of existing on-premises DCIM investments
also reinforce this segment's share.
Cloud-Based deployment is projected to
grow at the fastest CAGR during the forecast period as small and mid-sized
colocation and edge operators favor subscription-priced, remotely accessible
monitoring that avoids upfront server infrastructure and simplifies oversight
of geographically distributed sites from a centralized dashboard.
Deployment Mode categories include
·
On-Premises
(Dominating Segment)
·
Cloud-Based
(Highest CAGR Segment)
·
Hybrid
Analysis by Data
Center Type
Hyperscale data centers held the largest
market share in 2025 because their scale, facility count, and criticality
justify the highest per-site monitoring investment, and hyperscale operators
have been the earliest and most consistent adopters of advanced power and
thermal analytics platforms. The rapid expansion of AI workloads and
high-density computing is further increasing the need for continuous monitoring
of power, cooling, and equipment performance. In addition, the growing deployment
of hyperscale facilities by major cloud and digital infrastructure providers is
supporting demand for integrated infrastructure monitoring solutions.
Edge data centers are projected to grow
at the fastest CAGR during the forecast period as the proliferation of
distributed, often unstaffed edge sites supporting 5G, IoT, and low-latency
applications increases the need for remote, automated monitoring to substitute
for on-site technical staff. The expansion of edge deployments also increases
demand for real-time visibility into power, cooling, and equipment performance
across dispersed locations. Automated alerts and predictive monitoring help
operators identify faults quickly and reduce downtime at remotely managed
sites.
Data Center Type categories include
·
Hyperscale
(Dominating Segment)
·
Edge (Highest
CAGR Segment)
·
Colocation
·
Enterprise
By Region
Data Center Infrastructure Monitoring Market Regional Analysis
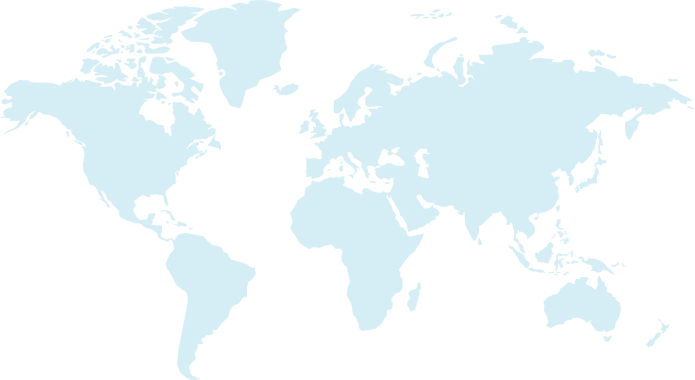
Data Center Infrastructure Monitoring Market Share 2025, (by Region)
Regional Analysis
North America held the largest market
share in 2025, accounting for 38% of global market share, supported by the
region's dense concentration of hyperscale and colocation facilities across the
United States and the early, sustained adoption of DCIM and monitoring
platforms among cloud and enterprise operators. The United States leads
regional demand through its large hyperscale build-out and stringent uptime
expectations from cloud service providers, while growing local grid-capacity
constraints are pushing operators toward tighter power monitoring. Canada is
seeing steady adoption tied to renewable-powered data center expansion.
Competitive intensity is high, with global platform vendors such as Schneider
Electric, Vertiv, and Nlyte maintaining strong regional sales and support
networks alongside specialized monitoring software providers.
Asia-Pacific is projected to grow at the
fastest CAGR during the forecast period, driven by rapid data center capacity
expansion across China, India, Japan, and Southeast Asia to support cloud, AI,
and digital-economy growth. Government-backed digital infrastructure programs
and data-localization policies in several Asia-Pacific markets are accelerating
new facility construction, and each new facility represents an incremental
monitoring deployment opportunity. India in particular is witnessing strong
hyperscale and colocation investment, while Japan and South Korea continue to
demand high-precision monitoring aligned with dense, land-constrained urban
data center designs.
Countries and Regions Covered
North America (Dominating Region)
o
United States
(Largest Country Market)
o
Canada
o
Mexico
Asia-Pacific (Fastest Growing Region)
o
China (Largest
Country Market)
o
India
(Fastest-Growing Country Market)
o
Japan
o
South Korea
o
Rest of
Asia-Pacific
Europe
o
Germany (Largest
Country Market)
o
United Kingdom
o
France
o
Italy
o
Rest of Europe
Latin America
o
Brazil (Largest
Country Market)
o
Chile
o
Rest of Latin
America
Middle East & Africa
o
Saudi Arabia
(Largest Country Market)
o
United Arab
Emirates (Fastest-Growing Country Market)
o
Rest of Middle
East & Africa
Market Share
The
market is fragmented, combining a small group of large, diversified power,
cooling, automation, and digital infrastructure manufacturers, including
Schneider Electric, Vertiv, Eaton, ABB, Siemens, Honeywell, Johnson Controls,
Legrand, Rittal, Delta Electronics, and Huawei, that bundle monitoring into
broader electrical, thermal, automation, and data center infrastructure
portfolios, alongside specialized DCIM and monitoring software vendors such as
Hewlett Packard Enterprise, Sunbird Software, EkkoSense, and FNT. High
switching costs tied to embedded sensor networks, installed infrastructure,
software integration, and long facility-refresh cycles favor established
vendors, while software-focused specialists compete on integration depth,
analytics capabilities, real-time visibility, and support for multi-vendor
hardware environments. Leading companies are prioritizing AI-based predictive
analytics, expanded liquid-cooling telemetry, automated infrastructure
optimization, and cloud-delivered monitoring-as-a-service offerings as
strategic differentiators. Partnership activity and technology integration
remain important growth strategies for software vendors, while equipment
manufacturers continue to strengthen their monitoring and analytics
capabilities through targeted technology investments, partnerships, and
selective acquisitions.
Key Players
·
Schneider Electric SE (France)
·
Vertiv Holdings Co. (United States)
·
Eaton Corporation plc (Ireland)
·
ABB Ltd (Switzerland)
·
Siemens AG (Germany)
·
Honeywell International Inc. (United States)
·
Johnson Controls International plc (Ireland)
·
Legrand SA (France)
·
Rittal GmbH & Co. KG (Germany)
·
Delta Electronics, Inc. (Taiwan)
·
Huawei Technologies Co., Ltd. (China)
·
Hewlett Packard Enterprise Company (United States)
·
Sunbird Software, Inc. (United States)
·
EkkoSense Ltd (United Kingdom)
·
FNT GmbH (Germany)
Recent Market Developments
- April
2025: Sunbird released
dcTrack 9.2.3, introducing enhanced UniversalConnector G2 capabilities for
real-time synchronization of asset information with platforms including
ServiceNow, Cisco ACI, and Equinix SmartView, strengthening multi-vendor
infrastructure visibility
- February
2026: Schneider Electric reported expanded EcoStruxure IT monitoring capabilities, including
liquid-cooling monitoring through Motivair integration, enhanced APIs, improved
NetBotz environmental/security monitoring, and plans for larger-scale
monitoring and digital-twin capabilities.
- June 2026: Schneider
Electric highlighted the evolution of EcoStruxure IT from a traditional
monitoring tool into a broader DCIM platform covering power, cooling, space,
compute, digital twins, predictive analytics, and real-time operational
visibility.
- July 2026: HPE
published the OneView 11.01 release and continued support for OneView Global
Dashboard, maintaining centralized observability and reporting across
distributed server and data-center environments.
Frequently Asked Questions
What is the Data Center Infrastructure Monitoring Market?
The Data Center Infrastructure Monitoring Market covers the sensors, software platforms, and services used to continuously track power, cooling, network, security, and IT asset performance across enterprise, colocation, hyperscale, and edge data center facilities.
What is driving the Data Center Infrastructure Monitoring Market growth?
Growth is driven by mandatory energy-performance disclosure rules such as the EU Energy Efficiency Directive, rising electricity costs, growing hyperscale and edge facility counts, and the need for granular thermal monitoring in high-density AI data centers.
What is the size of the Data Center Infrastructure Monitoring Market?
The global Data Center Infrastructure Monitoring Market was valued at USD 3.4 billion in 2025 and is projected to reach USD 12.4 billion by 2034, growing at a CAGR of 15.5%.
Which region dominates the Data Center Infrastructure Monitoring Market?
North America dominates the market, supported by its dense concentration of hyperscale and colocation facilities, while Asia-Pacific is the fastest-growing region due to rapid data center capacity expansion in China, India, Japan, and Southeast Asia.
Which monitoring type is growing the fastest?
Cooling & Environmental Monitoring is the fastest-growing monitoring type, driven by the shift toward high-density AI racks and liquid-cooling infrastructure that require finer-grained thermal telemetry.
What are the main end users of infrastructure monitoring?
Major end users include IT & Telecom, BFSI, Government & Defense, Healthcare, Manufacturing, and Energy & Utilities, with IT & Telecom holding the largest share and BFSI growing the fastest.
Why is the EU Energy Efficiency Directive significant for this market?
The Directive made energy-performance disclosure mandatory for data centers of 500 kW or more starting 1 July 2025, requiring continuous, auditable monitoring of PUE, water usage, and waste-heat metrics, directly increasing demand for monitoring infrastructure.
1
What is Data Center Infrastructure Monitoring?
2
What is the CAGR of the Data Center Infrastructure Monitoring Market?
3
Which component leads the Data Center Infrastructure Monitoring Market?
4
Which end user dominates the Data Center Infrastructure Monitoring Market?
5
Which deployment mode is growing the fastest?
6
What are the latest trends in the Data Center Infrastructure Monitoring Market?

Strong Industry Focus

Extensive Product Offerings

Customer Research Services

Robust Research Methodology

Comprehensive Reports

Latest Technological Developments

Value Chain Analysis

Potential Market Opportunities

Growth Dynamics

Quality Assurance

Post-sales Support

Regular Report Updates