Overview
The global Aquaculture Market was valued at USD 280.0
billion in 2025 and is projected to reach USD 453.3 billion by 2034, growing at
a CAGR of 5.5% during the forecast period (2026–2034). The market growth is driven
by rising demand for affordable, protein-rich seafood, stable wild-catch
volumes, and steady investment in feed, genetics, animal health, and farming
technology. The FAO's State of World Fisheries and Aquaculture 2026 reports
that aquaculture produced 103 million tonnes of aquatic animals in 2024,
passing 100 million tonnes for the first time, valued at USD 371 billion at the
farm gate. The market is shifting from extensive, low-input pond and coastal
farming toward intensive, data-driven, and better-certified production.
Producers are adopting AI-based feeding, underwater cameras, biological ERP
software, selective breeding, vaccines, and land-based RAS facilities to
improve survival rates and feed efficiency. Government initiatives such as
India's Pradhan Mantri Matsya Sampada Yojana (PMMSY), which has an allocation
of ?2,500 crore for 2026–27 to support aquaculture infrastructure, hatcheries,
and modern farming systems, and the FAO's Blue Transformation roadmap, which
promotes sustainable aquaculture growth, are encouraging new farm investment,
better disease management, and stronger traceability. By region, Asia-Pacific
held the largest share of the market in 2025, accounting for 62%, supported by
large-scale farming in China, India, Vietnam, and Indonesia. Middle East &
Africa is expected to be the fastest-growing region during the forecast period,
driven by new farm investment in Saudi Arabia and Egypt, feed capacity
additions in East Africa, and government programs to reduce seafood imports.
Market Size & Share
| Study Period: |
2021-2034 |
| Market Size in 2025: |
USD 280.0 Billion |
| Market Size in 2026: |
USD 295.4 Billion |
| Market Size by 2034: |
USD 453.3 Billion |
| Unit Value: |
USD Billion |
| Projected CAGR: |
5.5% (2026-2034) |
| Largest Region: |
Asia-Pacific |
| Fastest-Growing Region: |
Middle East & Africa |
| Fastest-Growing Culture Environment: |
Marine Water |
Market Dynamics
KEY MARKET TREND:
Digitalization,
Land-Based RAS, and Submerged Farming Emerging as a Transformational Trend
- Producers
are using AI-based feeding, underwater cameras, sensors, and biological ERP
software to track fish health, adjust feed use in real time, and reduce
mortality across ponds, tanks, and sea pens.
- Land-based
recirculating aquaculture systems and submerged or deep-farming cages are
moving from pilot projects to commercial scale as farmers seek better control
of water quality, sea lice, algal blooms, and warm-water events.
- Technology
suppliers, feed companies, and producers are working under standards such as
ASC and BAP, and competition is shifting toward integrated
technology-and-service offers, which is also driving consolidation among
equipment suppliers.
- AKVA group, a Norwegian
aquaculture technology supplier, won a NOK 200 million RAS contract from Årdal
Aqua in Q1 2026, and its EUR 28 million smolt facility contract with Laxey in
Iceland became effective on 23 June 2026 after financing was completed.
KEY MARKET DRIVER:
Rising
Global Seafood Demand and Plateaued Wild Catch are Driving Aquaculture Growth
- Wild
fish catch has stayed within a narrow range for more than three decades, so
most additional seafood supply must come from farming, making aquaculture
central to global food security.
- Consumers
in Asia, Europe, and North America are increasing fish consumption for its
protein and nutrition value, and retailers are asking for certified, traceable
products, which supports well-run commercial farms.
- Better
genetics, vaccines, feeds, and farm management tools are lifting yields and
survival rates, which improves farm economics and supports new investment in
feed mills, hatcheries, and processing.
- The FAO's SOFIA 2026
report (June 2026) states that aquaculture produced 103 million tonnes of
aquatic animals in 2024, valued at USD 371 billion at the farm gate, and
projects aquaculture to reach 119 million tonnes by 2034, while capture
fisheries remained stable at about 92 million tonnes.
KEY MARKET OPPORTUNITY:
Expansion
into Emerging Regions and Value-Added Products Creating New Growth Avenues
- Africa
and the Middle East have large untapped water resources and strong import
dependence, and the FAO notes that Africa has considerable potential for future
aquaculture development, opening room for new farms, hatcheries, and feed
plants.
- Alternative
feed ingredients such as insect meal, microalgae, and single-cell proteins can
lower dependence on fishmeal and fish oil, and offer feed makers new product
lines and cost stability.
- New
business models, including contract farming, insurance and credit programs for
small farmers, technology-as-a-service, and integrated feed-farm-processing
chains, are widening access to modern aquaculture.
- Government
initiatives such as China’s NMPA measures supporting innovative high-end and
novel biomaterial-based medical devices, along with India’s Medical Devices
Rules requiring licensing for import, manufacturing, sale, and distribution,
are strengthening regulatory pathways for collagen-based aesthetic products and
supporting expansion into emerging markets.

Aquaculture Market Size, 2025-2034 (USD Billion)
Segmentation Analysis
Analysis by Culture Environment
Freshwater aquaculture held the largest market share in
2025 because it is the backbone of global farmed fish production, with carp,
tilapia, catfish, and pangasius grown in ponds, cages, and reservoirs across
Asia, Africa, and Latin America. FAO data show that freshwater systems supplied
about 64 million tonnes, or 63%, of farmed aquatic animal production in 2024.
Low entry costs, abundant inland water, and strong local demand for affordable
protein support this lead.
Marine water aquaculture is projected to grow at the
fastest CAGR during the forecast period because coastal and offshore farming
supports high-value species such as Atlantic salmon, sea bass, sea bream, and
yellowtail. Producers are moving to larger and more exposed sites, submerged
cages, and deep-farming technology to reduce sea lice, algal, and warm-water
risks. Strong demand is supporting investment, with Mowi reporting a 9% rise in
salmon demand value in the second quarter of 2026.
Culture Environment categories include
·
Freshwater (Dominating Segment)
·
Marine Water (Highest CAGR
Segment)
·
Brackish Water
Analysis by Species
Finfish held the largest market share in 2025 because
carp, tilapia, catfish, pangasius, salmon, and trout are farmed in almost every
producing country and make up the bulk of farmed aquatic animal volumes. Asia
grows carp and tilapia mainly for local markets, while Norway, Chile, Scotland,
and Canada supply Atlantic salmon to export markets. Large integrated producers
such as Mowi, SalMar, and Lerøy, together with feed leaders such as Skretting,
BioMar, and Cargill, support steady supply.
Crustaceans, mainly shrimp and prawn, are projected to
grow at the fastest CAGR during the forecast period because of strong export
demand and higher farm-gate value per tonne. Ecuador, India, Vietnam, and
Indonesia are adding hatchery, feed, and pond capacity. BioMar plans to lift
its Ecuador shrimp feed capacity from 300,000 to 410,000 tonnes during 2026,
while India's PMMSY prioritizes shrimp farming, hatcheries, and systems such as
biofloc and RAS.
Species categories include
·
Finfish (Dominating Segment)
·
Crustaceans (Highest CAGR
Segment)
·
Mollusks
·
Aquatic Plants (Seaweed)
·
Others
Analysis by Culture System
Pond-based systems held the largest market share in 2025
because most farmed fish and shrimp in China, India, Bangladesh, Vietnam,
Indonesia, and Egypt are grown in earthen or lined ponds. Ponds need low
capital and suit carp, tilapia, catfish, and shrimp, which makes them
accessible to small and mid-sized farmers. Government programs that support
pond construction, seed, feed, and credit continue to expand pond area. Improved
aeration, water quality monitoring, and better feeds are raising yields without
a major change to the basic system.
Recirculating aquaculture systems (RAS) are projected to
grow at the fastest CAGR during the forecast period because they allow farming
on land with tight control of water, temperature, and biosecurity. Salmon smolt
and post-smolt producers are investing heavily, as shown by AKVA group's NOK
200 million RAS contract from Årdal Aqua and its EUR 28 million smolt facility
contract with Laxey in 2026.
Culture System categories include
·
Ponds (Dominating Segment)
·
Recirculating Aquaculture
Systems – RAS (Highest CAGR Segment)
·
Open Net Pens
·
Raceways & Flow-Through
Systems
Analysis by Distribution Channel
Traditional retail held the largest market share in 2025
because most farmed fish is consumed fresh in the countries where it is
produced, especially in China, India, Southeast Asia, and Africa. Buyers prefer
to check quality, size, and freshness in person, and local traders connect
small farms to nearby consumers. Low prices and flexible quantities also
support this channel. Even as modern retail expands, wet markets remain central
to daily fish purchases in many fast-growing urban areas.
Online stores are projected to grow at the fastest CAGR
during the forecast period as e-commerce platforms, quick-commerce apps, and
direct-to-consumer seafood brands expand cold-chain delivery. Consumers value
traceability, ready-to-cook options, and doorstep delivery, which online
channels provide. Producers and processors are building digital sales platforms
and subscription models to reach households directly. Better last-mile refrigeration
and QR-based origin tracking are reducing quality concerns and supporting
repeat orders, especially in India, China, Southeast Asia, and urban centers in
North America and Europe.
Distribution Channel categories include
·
Traditional Retail (Dominating
Segment)
·
Online Stores (Highest CAGR
Segment)
·
Supermarkets
·
Food Service
·
Others
By Region
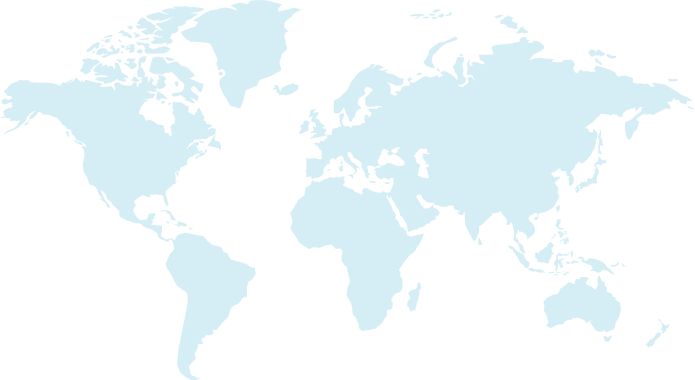
Aquaculture Market Regional Analysis
Aquaculture Market Share 2025, (CAGR)
Regional
Analysis
Asia-Pacific held the largest market share
in 2025, accounting for 62% of the global market share. China is the largest
country market, supported by the scale of its freshwater and marine aquaculture
industry and its position as the world’s largest producer of farmed aquatic
animals. India is the fastest-growing country market, with expanding inland and
shrimp aquaculture supported by sector development and modernization
initiatives. South Korea remains a key manufacturing and aquaculture hub, while
Japan represents a mature market with established marine and inland farming
capabilities. The wider Asia-Pacific region, including Southeast Asian markets,
adds significant shrimp, pangasius, finfish, and aquatic-plant production.
FAO’s 2026 data show that Asia produced 179 million tonnes of aquatic animals
and algae in 2024, including nearly 130 million tonnes from aquaculture, with
China, India, Indonesia, Viet Nam, and Bangladesh among the major producers.
Technology adoption includes aeration, biofloc, recirculating aquaculture
systems (RAS), smart feeding, and improved water-quality monitoring, while regulation
increasingly focuses on disease control, aquatic drug limits, environmental
sustainability, and traceability for export markets.
Middle East & Africa is projected to
grow at the fastest CAGR during the forecast period from a smaller base. The
United Arab Emirates is the largest country market in the region, supported by
government initiatives to expand aquaculture farms, improve regulatory and
investment conditions, and strengthen domestic food security. The UAE launched
a National Plan for Stimulating and Developing the Aquaculture Sector in 2024,
with objectives including increasing farm numbers and production and improving
the investment environment. Saudi Arabia is the fastest-growing country market,
with Vision 2030-linked initiatives supporting hatcheries, fish and shrimp
production, biosecurity, private-sector investment, and modern aquaculture
technologies; the government has targeted substantial increases in domestic
aquaculture production. The wider Middle East & Africa region is also seeing
increasing adoption of RAS, cage culture, and biofloc systems, particularly
where water availability and food-import dependence create incentives for
controlled production.
Countries
and Regions Covered
Asia-Pacific (Dominating Region)
o
China (Largest Country Market)
o
South Korea
o
India (Fastest-Growing Country
Market)
o
Japan
o
Rest of Asia-Pacific
North America
o
United States (Largest Country
Market)
o
Canada
o
Mexico
Europe
o
United Kingdom
o
Germany
o
France
o
Italy
o
Rest of Europe
Latin America
o
Chile (Largest Country Market)
o
Brazil
o
Rest of Latin America
Middle East & Africa (Fastest Growing Region)
o
U.A.E (Largest Country Market)
o
Saudi Arabia (Fastest-Growing
Country Market)
o
Rest of Middle East &
Africa
Market Share
The market is fragmented overall because
millions of small and medium farms, mainly across Asia and Africa, supply most
of the world's farmed fish and shrimp. However, specific segments are
consolidated, with salmon farming and aquafeed led by established companies such
as Mowi ASA, Charoen Pokphand Foods PCL, Cargill, Incorporated, Tongwei Co.,
Ltd., BioMar Group, SalMar ASA, Cermaq Group AS, Lerøy Seafood Group ASA, Cooke
Inc., Guangdong HAID Group Co., Ltd., Nissui Corporation, Umios Corporation,
Camanchaca S.A., Vinh Hoan Corporation, and Avanti Feeds Limited. Key success
factors include biological performance, feed cost control, access to licenses
and sites, disease management, and strong cold-chain and market access. Leading
companies are prioritizing volume growth in lower-cost regions, selling
low-margin assets, and expanding feed capacity near shrimp and tilapia farming
hubs. Innovation is focused on RAS and submerged farming, genetics, vaccines,
alternative feed ingredients, and AI-based monitoring. Acquisitions and
partnerships are common, as seen in Mowi's Nova Sea purchase and its sale of
Canada East to Cooke, and in the Tongwei and BioMar joint venture in China.
Key
Players
·
Mowi ASA (Norway)
·
Charoen Pokphand Foods PCL
(Thailand)
·
Cargill, Incorporated (United
States)
·
Tongwei Co., Ltd. (China)
·
BioMar Group (Denmark)
·
SalMar ASA (Norway)
·
Cermaq Group AS (Norway)
·
Lerøy Seafood Group ASA
(Norway)
·
Cooke Inc. (Canada)
·
Guangdong HAID Group Co., Ltd.
(China)
·
Nissui Corporation (Japan)
·
Umios Corporation (Japan)
·
Camanchaca S.A. (Chile)
·
Vinh Hoan Corporation (Vietnam)
·
Avanti Feeds Limited (India)
Recent
Market Developments
- April 2025: Skretting inaugurated its first dedicated LifeStart hatchery feed production
line in Asia at Zhuhai, China, on 17 April 2025, and introduced five new
LifeStart products for salmon, tilapia, golden pompano, snakehead, and catfish.
The move strengthens Skretting's position in China's early-life-stage feed
segment and supports higher fry survival and disease resistance.
- July 2025: Cermaq agreed to acquire Grieg Seafood’s farming operations in Finnmark,
British Columbia, and Newfoundland for USD 1.06 billion, expanding its
salmon-farming footprint in Norway and Canada
- October 2025: Mowi received final regulatory approval for its acquisition of a
controlling stake in Nova Sea after the EU Commission and the Norwegian
competition authority cleared the deal on 21 October 2025. The agreement, first
announced in January 2025, raised Mowi's ownership from 49% to 95% and lifted
its expected 2025 harvest to 597,000 tonnes, with annual synergies
preliminarily estimated at NOK 400 million.
- March 2026: Mowi completed the merger of Nova Sea into Mowi ASA, effective 3 March
2026, while keeping the Nova Sea brand and Lovund operations unchanged. Shortly
after, Mowi agreed to acquire the seawater farming operations of Torghatten
Aqua in production area 8, which are expected to produce about 4,500 tonnes of
salmon a year, strengthening its position in Northern Norway.
Frequently Asked Questions
What is the Aquaculture Market?
The Aquaculture Market covers the farming of fish, crustaceans, mollusks, and aquatic plants in freshwater, brackish, and marine environments, along with related feed, genetics, health, equipment, and processing activities.
What is driving the Aquaculture Market growth?
Growth is driven by rising seafood demand, stable wild-catch volumes, better genetics, feeds, and vaccines, and government programs that support farm investment and sustainable production.
What is the size of the Aquaculture Market?
The global Aquaculture Market was valued at USD 280.0 billion in 2025 and is projected to reach USD 453.3 billion by 2034, growing at a CAGR of 5.5%.
Which region dominates the Aquaculture Market?
Asia-Pacific dominates the market with a 62% share in 2025, supported by large-scale production in China, India, Vietnam, and Indonesia, while Middle East & Africa is the fastest-growing region.
Which culture environment is growing the fastest in Aquaculture?
Marine water aquaculture is the fastest-growing culture environment, driven by demand for salmon and other high-value marine species and the shift to offshore and submerged farming.
Which species is growing the fastest in Aquaculture?
Crustaceans, mainly shrimp and prawn, are the fastest-growing species group, supported by export demand and new hatchery, feed, and pond capacity in Ecuador, India, and Vietnam.
Why is RAS important for the Aquaculture Market?
Recirculating aquaculture systems allow land-based farming with tight control of water, temperature, and biosecurity, and are the fastest-growing culture system, especially for salmon smolt and shrimp.
2
What is the CAGR of the Aquaculture Market?
3
Which species leads the Aquaculture Market?
4
Which culture system dominates the Aquaculture Market?
5
Which product form has the highest market share?
6
What are the latest trends in the Aquaculture Market?
7
Who are the end users of Aquaculture products?

Strong Industry Focus

Extensive Product Offerings

Customer Research Services

Robust Research Methodology

Comprehensive Reports

Latest Technological Developments

Value Chain Analysis

Potential Market Opportunities

Growth Dynamics

Quality Assurance

Post-sales Support

Regular Report Updates